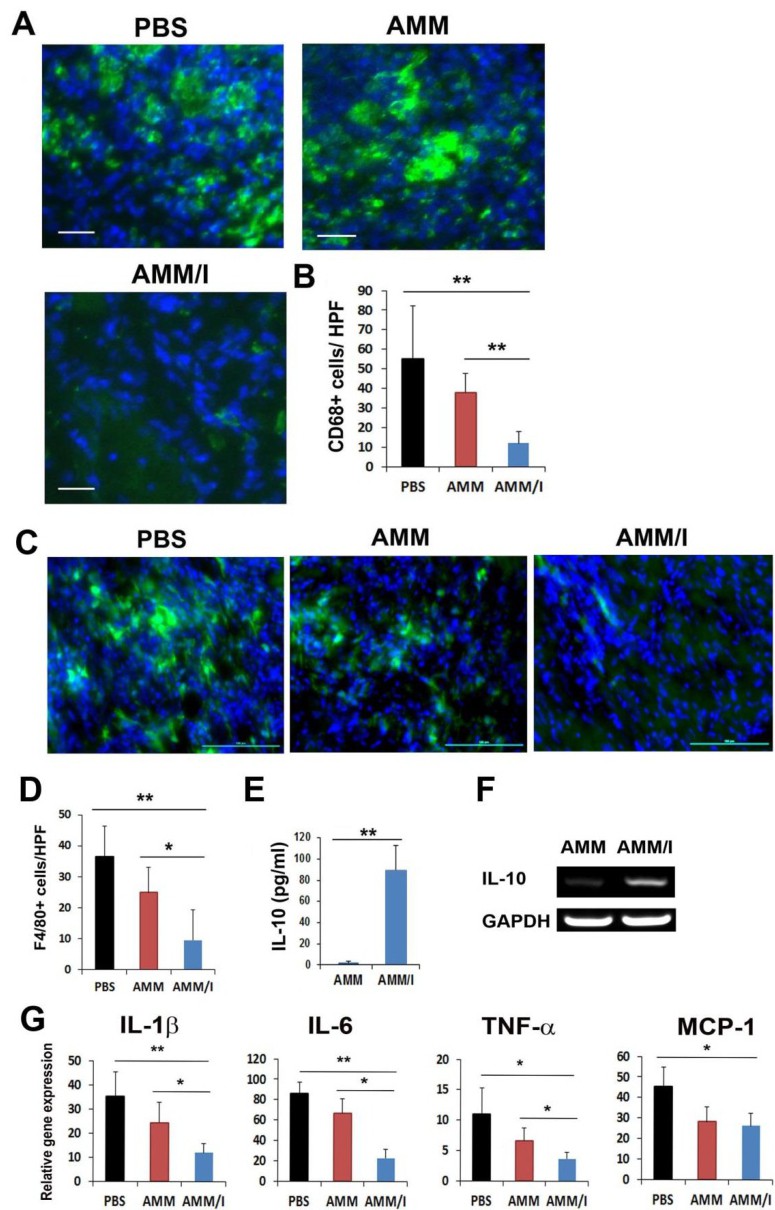
Fig. 3. Anti-inflammatory activity of AMM/I in MI. (A) Representative pictures of the infiltrated inflammatory cells (CD68-positive, green color) 3 days after cell injection in MI heart tissues. Bars: 50 µm. (B) Quantitative analysis of infiltrated CD68-positive inflammatory cells 3 days after cell injection in MI heart tissues. HPF, high-power field. **p<0.01, *p<0.05; n = 7 per group. (C) Representative pictures of the infiltrated inflammatory cells (CD68-positive, green color) 3 days after cell injection in MI heart tissues. Bars: 50 µm. (D) Quantitative analysis of infiltrated F4/80-positive inflammatory cells 3 days after cell injection in MI heart tissues. **p<0.01, *p<0.05; n = 6 per group. (E) ELISA for IL-10 in the AMM/I and AMM injected LV heart tissues. The amount of IL-10 was markedly higher in the AMM/I injected tissues than AMM injected tissues groups. n = 6 per group. (F) IL-10 mRNA (RT-PCR) expression levels were detected in the AMM/I and AMM injected LV heart tissues. (G) qRT-PCR results from the samples harvested from the mice heart tissues of at 3 days after cell injection in MI. **p<0.01, *p<0.05; n = 5 per group.